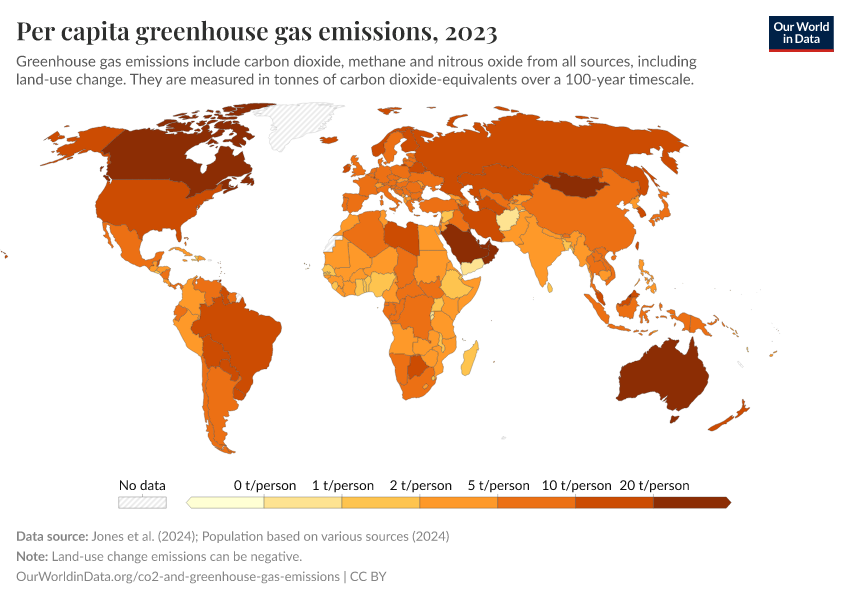
Per capita greenhouse gas emissions including land use

About this data
Related research and writing
About this data
Sources and processing
This data is based on the following sources
How we process data at Our World in Data
All data and visualizations on Our World in Data rely on data sourced from one or several original data providers. Preparing this original data involves several processing steps. Depending on the data, this can include standardizing country names and world region definitions, converting units, calculating derived indicators such as per capita measures, as well as adding or adapting metadata such as the name or the description given to an indicator.
At the link below you can find a detailed description of the structure of our data pipeline, including links to all the code used to prepare data across Our World in Data.
Notes on our processing step for this indicator
Emissions given in tonnes have been converted to carbon-dioxide equivalents over a 100-year timescale using a conversion factor of 273 for nitrous oxide, 29.8 for methane from fossil sources, and 27.2 for methane from agricultural and land use sources. These factors are taken from the 6th Assessment Report (AR6) of the Intergovernmental Panel on Climate Change (IPCC).
Reuse this work
- All data produced by third-party providers and made available by Our World in Data are subject to the license terms from the original providers. Our work would not be possible without the data providers we rely on, so we ask you to always cite them appropriately (see below). This is crucial to allow data providers to continue doing their work, enhancing, maintaining and updating valuable data.
- All data, visualizations, and code produced by Our World in Data are completely open access under the Creative Commons BY license. You have the permission to use, distribute, and reproduce these in any medium, provided the source and authors are credited.
Citations
How to cite this page
To cite this page overall, including any descriptions, FAQs or explanations of the data authored by Our World in Data, please use the following citation:
“Data Page: Per capita greenhouse gas emissions including land use”, part of the following publication: Hannah Ritchie, Pablo Rosado, and Max Roser (2023) - “CO₂ and Greenhouse Gas Emissions”. Data adapted from Jones et al., Various sources. Retrieved from https://auto-epoch.owid.pages.dev:8789/20260119-070102/grapher/per-capita-ghg-emissions.html [online resource] (archived on January 19, 2026).How to cite this data
In-line citationIf you have limited space (e.g. in data visualizations), you can use this abbreviated in-line citation:
Jones et al. (2025); Population based on various sources (2024) – with major processing by Our World in DataFull citation
Jones et al. (2025); Population based on various sources (2024) – with major processing by Our World in Data. “Per capita greenhouse gas emissions including land use” [dataset]. Jones et al., “National contributions to climate change 2025.1”; Various sources, “Population” [original data]. Retrieved February 1, 2026 from https://auto-epoch.owid.pages.dev:8789/20260119-070102/grapher/per-capita-ghg-emissions.html (archived on January 19, 2026).